A minimum keystroke (py)Debugger for Lazy ML/DS people who don't IDE
I’m killing myself slowly. Wasting my life away, with all the bugs I introduce.
The more fluent I get, the more bugs I create, cos its no longer about syntax errors and it’s not easy to write tests for Machine Learning/Data Science projects. This while loop seems to run with no stop condition other than my death:
while suz.isalive():
  everything.compiles()
  everything.runs()

  if lucky:
    time.sleep(86400) # one day

  else:
    time.sleep(86400*7) # one week

  print("An obvious bug: you didn't check the output dummy")
  code.fix()
Edit: David Snyder points out a bug in the above; that it should be suz.fix(code).
A girl does nothing. While the code fixes itself.
(If you don’t get the reference, well Valar morghulis.)
The problem is I’m too stupid to write good assert statements, and too damn lazy to (1) Set up and check the output of a log file, (2) drop pdb.set_trace() and print around my code even if nothing crashes. Hey why fix what isn’t broken (Ans: See while loop above)
The bigger problem is when we have a for-loops and we want to inspect just one run of the for
loop, I get even lazier to write: if i==0: print(a, b, c, d). Worse still, I accidentally
print/log a huge text file/dictionary/list/obj/numpy array and have to bang furiously on the
ctrl+c or just give up and go for the 10th tea break.
The answer is a one script fully contained debugger for people like me who don’t use IDEs.
We want something to check the value of ANY variable from ANY FILE and any function, without fear of spamming your screen again. For lazy people to do manual checks without writing manual code, esp since its hard to write sensible unit tests for ml projects.
I have just decided to call it the screen-life-saver. Never spam your screen again!!
Benefits:
- ONLY PRINT/TRACE ONCE! Even if you’re inside for loops!
- Dont need to instantiate complicated class to debug in Ipython
- Check small functions - no excuses to be lazy anymore!
- Don’t print if the object size is too large - save your screen and your life energy.
Additional stuff one might care about
- Shows variable object type and size.
- Shows which file and function we are printing from.
- Turn on and off print statements really super easily.
- Automatically fixes your significant figures printing.
Why you Should NOT use this.
- If you want more functionality and actually want to record everything (check out python logging module)
- If you can actually write unit tests for your code (check out python unittest)
- If you want to step through your code (check out pdb)
Usage:
- cp to a utilities folder in your home dir, i.e.
~/global_utils - Add this to your .bashrc,
export PYTHONPATH="${PYTHONPATH}:~/global_utils" source ~/.bashrc- Then in any .py file, (I add it to my .py templates)
from debugger import Debugger
DB = Debugger()
DB.debug_mode=True  # Set to False to kill all printing

class ComplicatedClass:
    def complicated_fn_to_debug(self):
        var1 = ..
        var2 = ..
        DB.dp({'var1_name': var1, 'var2_name':var2}) # before

        var1 = dosomething(var1)
        var2 = dosomething(var2)
        DB.dp({'var1_name':var1, 'var2_name':var2}) # after

        DB.dp()
        # if no arguments given, print all variables in this function
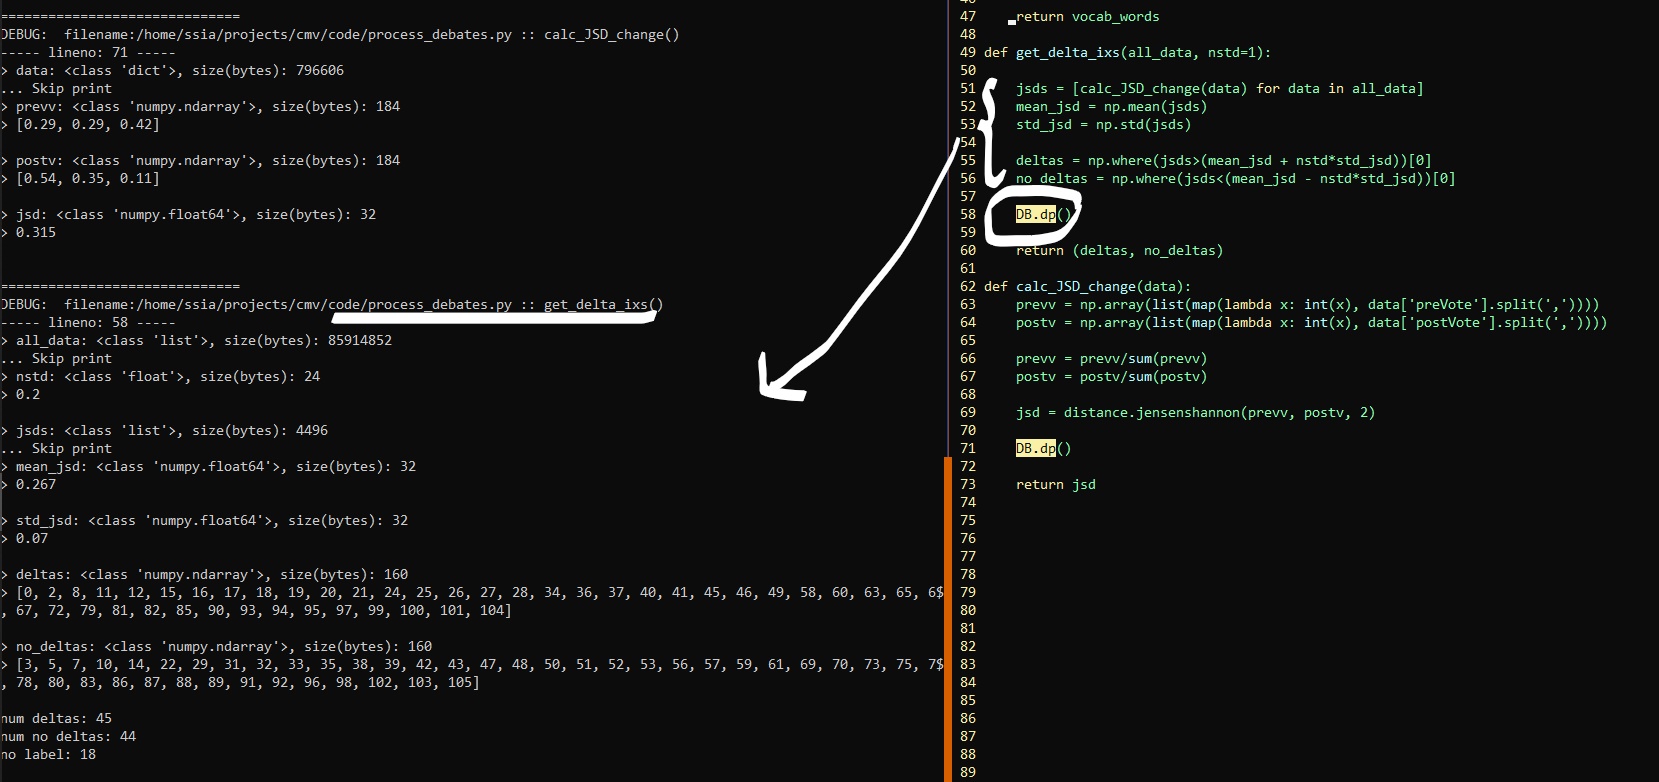
Here’s how it looks:
Notice that:
- With just
.dp()- Print all variables in the function - ULTIMATE LAZY.
We can also be selective about the variables we print and the naming, via DB.dp('var1':var1), but really this was designed assuming you dont know what you should be selective about (if you knew you wouldn’t be creating
bugs).

The gist of it
Here’s how it works if you wanted to modify on top of this script:
- line 16, 17 makes sure that we only print once even in horribly nested loops
- line 23 gives us file names and functions with
inspectmodule - line 26 gives us all the variables
- line 36-45 are just cosmetics
- line 30 and 42 make sure that we don’t spam the screen if the object is too large
Acknowledgements
Credits to a conversation with Jiamin that inspired me to do something like this. And for my advisor who rightly pointed out I need to do more manual checking.