Studying drug-drug interactions and predictors of adverse vascular outcomes
Contributors: Suzanna Sia(co-author), Anthony Li(co-author), Bryce Tan, Yang Qianyu, Lee Chen Fei, Wang Zhi, Gabriel Chew, Charumathi Sabanayagam
Introduction
The NUS-MIT-Datathon brought together teams of clinicians and data scientists to address clinical problems with data. The objective was to utilise healthcare records to answer some of the existing clinical challenges and for these to be translated to actionable insights for patient outcomes. we participated in the General Clinical Track (one of three tracks) which utilised 10 year hospital Electronic medical records (EMR) data from the Department of Surgery, hosted on the NUHS Discovery platform. The event was jointly organised by National University of Singapore(NUS), National University Health System(NUHS), and MIT.
The clinical objective that we tackled was, ‘how to examine the impact of biomarkers/drug-drug interactions on adverse cardiovascular outcomes (IHD, PVD, HF, Stroke, CKD) in a cohort of diabetes-mellitus patients with up to 10 years of follow-up data.
Note: The work and results described here are very preliminary and completed on short duration. We emphasise that all of this is work in progress.
Motivations
Diabetes Mellitus (DM) is a condition which affects 8.6% of the population in Singapore. This group of patients are more likely to suffer from complications such as stroke, ischemic heart disease, kidney disease, peripheral vascular artery disease, neuropathies and retinopathies. To control the progression of DM and reduce the associated complications, patients are often started on multiple medications and subjected to close follow up. This translates into costly medical bills for these individuals and high utility of limited health care resource.
Therefore, there is a significant need to improve prognostication tools for purposes of screening, optimise pharmacological treatment and streamline therapeutic options.In this particular study, we aim to correlate demographic, lab results and medications with outcomes. Specifically, we want to find the appropriate combination of drugs to use or the right health status to maintain that would improve outcome and reduce complications.
Methods Overview
-
Data Extraction and Exploration - We sampled all DM surgical patients who had been admitted to NUHS Surgical department between 2004 and 2010. All pharmacological interventions, sociodemographic data, past medical history, and laboratory data were gathered to be used as predictors of composite cardiovascular outcomes measured across 5 years from 2010-2014 from 5 categories: IHD, CKD, Stroke, PVD, and HF. The resultant number of patients in our dataset was 10,389, and the incidence of adverse cardiovascular outcomes was 551 (5.3%).
-
NLP - We initially attempted to utilise pre-trained open-source clinical disease extraction models. However most of these had been trained on clinical notes that were much ‘cleaner’ than the notes that we had in the dataset. Hence we adopted fuzzy string match of clinical notes, with disease dictionaries (provided by the clinician) to deal with variations in writing, mispellings, short-forms etc. The accuracy of the extraction was manually verified by a trained clinician.
-
Feature Processing - For categorical variables, we created dummy numerical variables to represent each category. We subsequently scaled this variables by subtracting the mean and scaling to unit variance.
-
Train and Predict - We divided the data into 5 folds for cross validation. At each iteration, we use four folds for training the model and one fold to test the model.We divided the data into 5 folds for cross validation. At each iteration, we use four folds for training the model and one fold to test the model.
-
Results
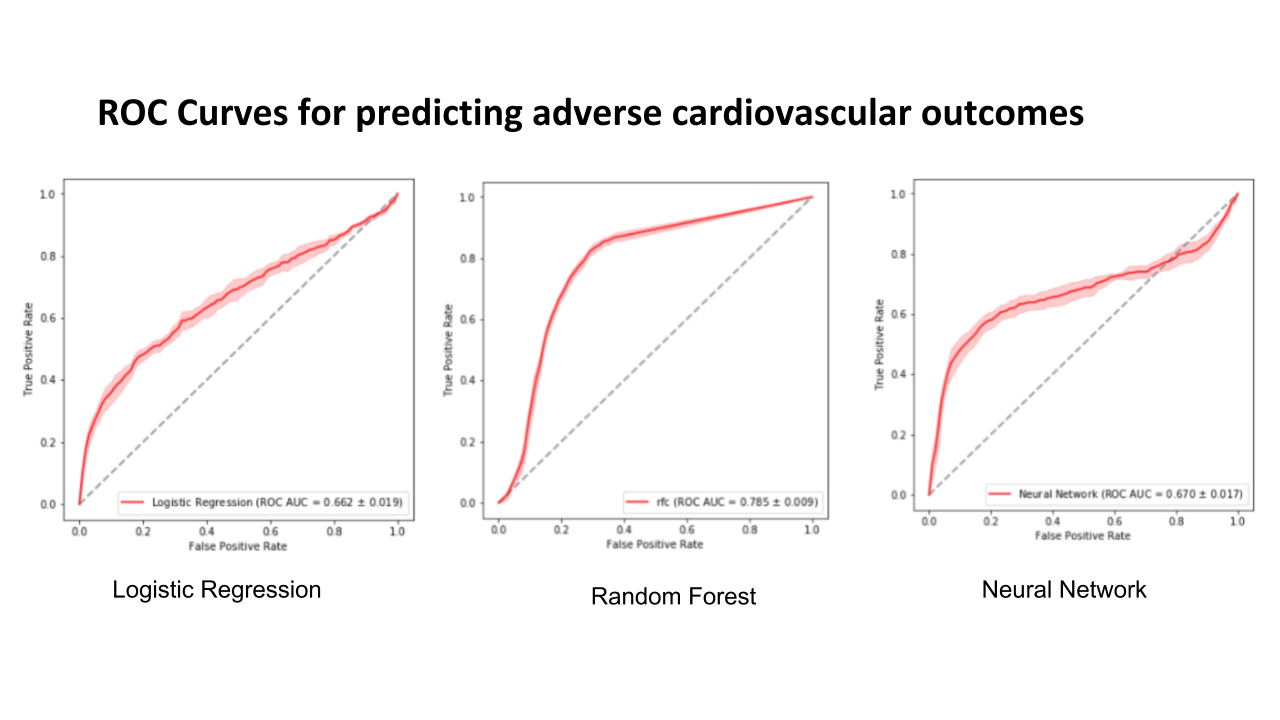
The results show that random forest has the highest area under receiver operator curve. All the models have low average precision values.
| Ridge Regression | Random Forest | Multi-layer Perceptron | |
|---|---|---|---|
| C-statistic | 0.662 | 0.785 | 0.670 |
| Average Precision | 0.189 | 0.210 | 0.224 |
The following figure shows the ROC curves for predicting adverse cardiovascular outcomes.
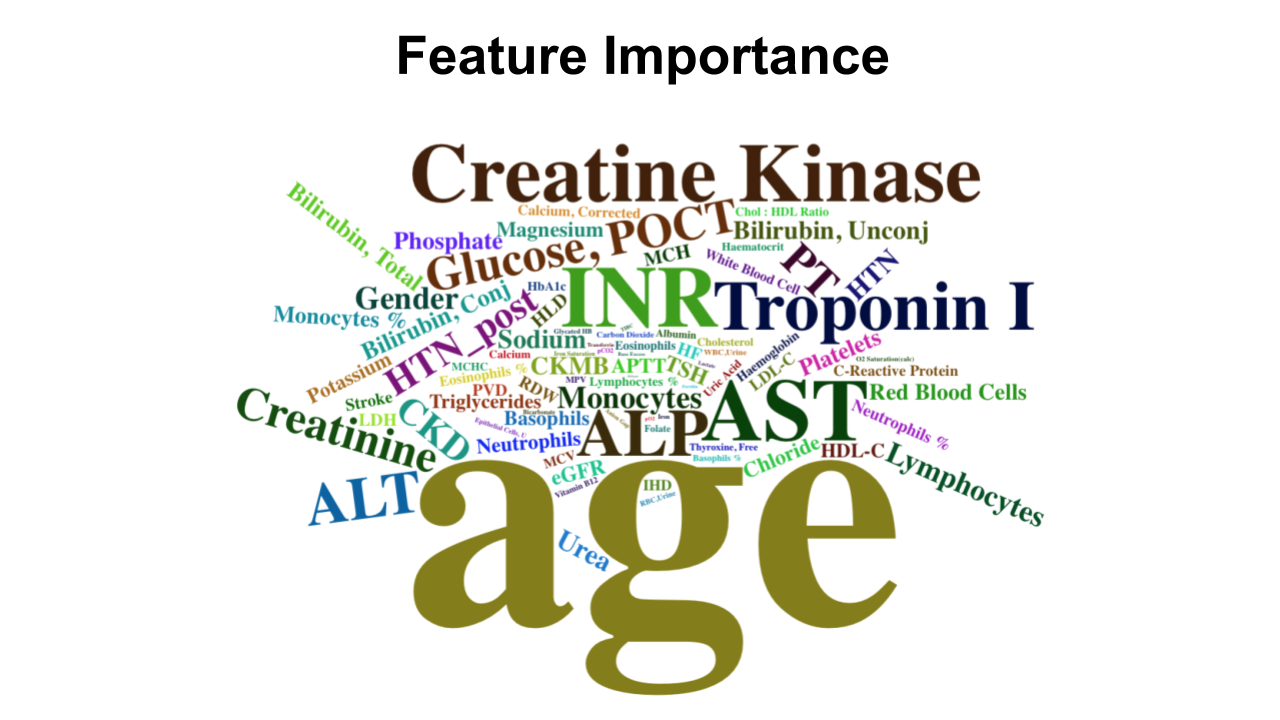
Feature Importance
The following shows a cloud of the most important features as discovered by the Random Forest Classifier. Size reflects the importance of the feature. Unsuprisingly, age is the most important. Biomarkers known to be important also feature in the word cloud.
Discussion
These results coincide with our understanding that ML techniques are superior to traditional statistical techniques with respect to processing large datasets to identify complex patterns. The severe imbalance of outcome labels resulted in a low average precision value. This is not unexpected since precision (also known as positive predictive value) is dependent on the prevalence of the dataset.
Future Work
-
Feature Selection of medication usage. Firstly. we want to restudy the way we treat our medication variables. Our current approach treats each medication as a binary variable. 1 for having been prescribed the medication and 0 for absence of prescription. Our future work will include the dosage of individual drug values.
-
Model other cardiovascular-specific outcomes. We have yet to differentiate between different adverse cardiovascular outcomes, such as ischemic heart disease and pulmonary heart disease. The different diseases could have different patterns of presentation that is well worth further investigation.
-
Risk stratification and range of clinical values. The modelling algorithms used are able to rank clinical features by importance, but these are not particularly insightful nor actionable for a clinician. The next steps would be to investigate the range of values that lead to more positive outcomes, which could serve as a guidelines for clinicians to monitor the patient. Although the current results are useful in helping clinicians to identify important mortality and morbidity factors, these models do not change the way clinicians practice because there is no clear direct implementation of these models in a clinical setting. Rather, the simplest linear models are simplified into various clinical scores in the clinical setting to perform risk stratification. This stratification process is paramount in helping clinicians to decide the next best management step for patient.
Lessons Learnt
-
Pair programming. Pair programming at this particular datathon is a gross understatement. At times it was more like quadruplet programming. Each team had only one work station with access to the data which had to stay in the server throughout the competition. Pairing was effective for the most part, but we could have done better by anticipating the needs of the driver and googling ahead of what was required instead of the googler primarily correcting minor syntax problems. The googler should also prototype more complicated code blocks in a separate notebook.
-
Complexity of fuzzy string matching algorithms. My go-to for string match algorithms has always been Leshvenstein or edit distance with the python
fuzzywuzzylibrary. This turned out to be too expensive to run on over 200,000 short clinical notes because of the $O(|w_1| \times |w_2|)$ time complexity, where $|w_1|$ and $|w_2|$ are the string length of word 1 and word 2 for word pair comparison. Every word in the document needs to compared to every word in the disease dictionary, which is $|C|\times C_n \times D_m$ comparisons, where $|C|$ is the number of clinical documents, $D_m$ is the number of disease dictionary words, and $C_n$ is the average number of words in one clinical document. In the end we adopted the Jaro-wrinkler distance which is less ‘precise’ in a way but has a much shorter runtime for a word pair comparison of $O(|w_1| + |w_2|)$. -
Estimating runtime with ipython magic function %timeit - Developing on external examples was especially misleading because runtime issues do not show up testing on a small number of examples. It’s easy to forget about runtime and think that you’re done just because you passed the test cases. Ultimately we adopted the approach of setting an acceptable time that the algorithm had to finish running by, and gradually shaving down the miliseconds per example to microseconds, trading of algorithm correctness for speed.
-
Fluencies with database query languages. - Weakness in self-taught or academia based data scientists, where datasets are small and shipped around in csv files.
-
Instability of Ipython notebooks - Fair bit of time wasted interrupting unwanted jobs yet and puzzling over why that darn [*] is still there, or puzzling over whether the cell was taking that long to run or had simply crashed. Reason why I dont like jupyter notebooks. No good workarounds yet.
References
NUS-NUHS-MIT Healthcare AI Datathon and Expo 2018 Singhealth - Diabetes Mellitus