Capturing Last-mile Transactions of Smallholder Palm Oil Farmers
Introduction
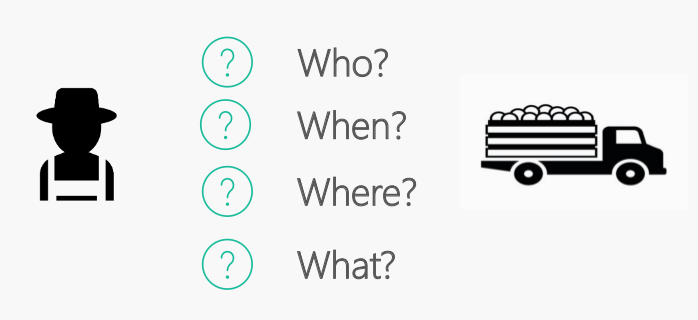
Recently, TEAM LISA participated in a hackathon centered around the palm oil ecosystem in Indonesia. The major players in the ecosystem are the end-consumers (that’s us), the buyers of palmoil (Unilevers, P&G), the fertiliser and seeds companies (Bayer), the NGOs (WWF, Growasia), the financers(banks), and the producers(smallholder farmers).
We proposed a solution targeted traceability of palm oil from the mill to the source (smallholder farmers), credit-scoring for smallholder-farmers who have no land titles, and monitoring of initiatives.
Motivations
-
Traceability - In the palm oil supply chain from buyer to smallholder, there are at least 3 degrees of separation, such that it becomes difficult to trace whether the palm oil is being farmed from a sustainable source (not from deforested or peat land). The gold-standard certification RSPO is expensive for smallholder farmers, and requires the farmers to have land titles. Less than 5% have RSPO certification. Verification of sustainable farming is slow and requires human survey (it takes half to one day to survey one smallholder farm of about 6Ha).
-
Credit Scoring - Palm oil needs to be replanted once every 15 years and farms usually require loans to do replanting. However there is insufficient collateral for banks to hand out loans because the farmers often do not own land titles. As such, farmers would benefit from an alternative credit scoring mechanism based on their produce, but typically do not keep any verifiable transaction history as most transactions are based on paper receipts.
-
Monitoring of Initiatives - Initiatives designed to help smallholder farmers such as training programs for sustainable farming and appropriate fertiliser use are difficult to monitor at scale. This makes it difficult to review what initiatives are working.
All the above problems could be simultaneously addressed with a better data collection and verification mechanism. However this is currently not possible because of the number of smallholder farmers and multiple levels in the supply chain pipeline. A palmoil refinery could be purchasing from 50 mills, where each mill sources from approximately 5000 farmers in the area. The mill has several collection points, and works with local agents who pay truck drivers to drive to rural farm areas to collect the fresh-fruit-bunches.
Solution Overview
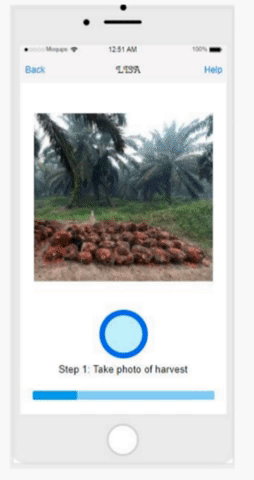
We designed a mobile/web-app based solution for capturing transactions between smallholder farmers and the truck drivers to directly address traceability for sustainability, credit-scoring, and monitoring of initiatives. The basic idea is this. At the point of transaction when his goods are being picked up, the farmer takes a selfie (for credit-scoring), a photo of the recipt (credit-scoring), a photo of the fresh-fruit-bunch (anti-fraud), and a photo of the agent’s QR code which is distributed to drivers (traceability).
His location is geolocated by mobile phone and satelite imagery of the area can be used to determine whether there had been deforestation activity. With sufficient transaction history captured, financers would be able to credit-score the farmer. Transaction produce and satellite imagery of the farmer’s land also allows NGOs to monitor the effectivenss of their initiatives.
The application consist of the following:
- Hosting web application with express.js
- Enabling camera to take photos
- Post and Get results from Node backend
- Controller logic to Google Cloud vision API
- Geolocating user location
- Mapping with CartoDB
- Farmer profiling
Post and Get results from node backend
- Set up photocapture
- Write function to process picture taken by POST-ing image to backend and display results either in the form of a bounding box on canvas or labels detected.
//public/javascripts/photocapture.js
(function(){
function processPicture(){
var data = photo.getAttribute('src');
var detect_mode = $('#photo').data('detect_mode');
$.post("/procpicture", {img: data, detect_mode: detect_mode})
.done(function(results){
var ctx = canvas.getContext('2d');
ctx.beginPath();
ctx.lineWidth=10;
ctx.strokeStyle='red';
if (detect_mode=="face"){
ctx.beginPath();
v0 = results[0];
v2 = results[2];
ctx.rect(v0.x, v0.y, v2.x-v0.x, v2.y-v0.y);
ctx.stroke();
}
...
})
}
...
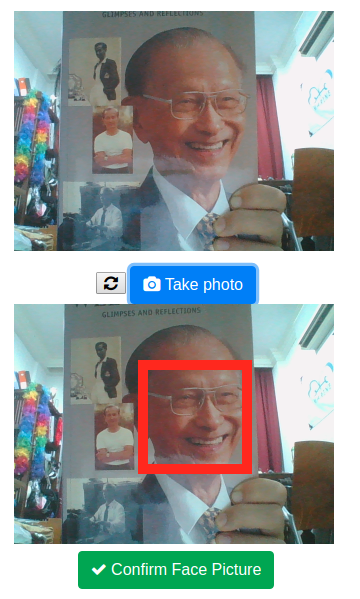
})();An example of face capture with bounding box.
Credits: Singapore former president Mr Wee Kim Wee- “We have to be here and we shall be here, to take care of one thing at a time and only cross the bridge when we arrive at it.”
Example of label detection. Interestingly, Google’s label detection algorithm predicts palm oil fruits as Rambutans. We didn’t have palm oil fruits on hand so we used rambutans for the proof-of-concept.
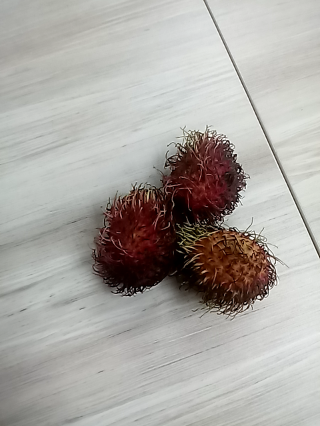
{'description': 'rambutan', 'score':0.7541,
'description': 'soapberry', 'score':0.6133,
'description': 'still life photography', 'score': 0.5040}
Controller logic to Google Cloud vision API
- Install client library with
npm install --save @google-cloud/vision - Set up authentication as per official instructions
- Save application credentials to a key e.g.,
./keys/googlecv_key.json - Write logic to use different cloud vision functions. Here we used Text Detection, Face Detection, and Label Detection. For face detection, we are only intersted in the bounding boxes.
// image_api.js

const vision = require('@google-cloud/vision');
const client = new vision.ImageAnnotatorClient({
  keyFilename: './keys/googlcv_key.json',
});

exports.process = function(image, detect_mode, response){
  if (detect_mode=="receipt"){
    client.documentTextDetection(image)
          .then(results => {
            const textAnnotation = results[0].fullTextAnnotation;
            res.send(textAnnotation);
    })
    .catch(err => {
      console.log('Text detection error:', err);
    });

  } else if (detect_mode=="objects"){
    client.labelDetection(image)
          .then(results=> {
            const labels = results[0].labelAnnotations;
            res.send(labels);
    })
    .catch(err => {
      console.log('Object detection error;', err);
    });

  } else if (detect_mode=="face"){
    client.faceDetection(image)
          .then(results=> {
            const faceAnnotation = results[0].faceAnnotations;
            vertices = faceAnnotation[0].fdBoundingPoly.vertices;
            res.send(vertices);
    })
    .catch(err=> {
      console.log('Face detection error:', err);
    });
}- Write function to post captured images in
index.js
// index.js

var express = require('express');
var app = express();
var imageAPI = require('./image_api.js');

...

app.post('/procpicture', function(request, response){
  var detect_mode = req.body.detect_mode;
  var data = req.body.img.replace(/^data:image\/\w+;base64,/, "");
  var buf = new Buffer(data, 'base64');
  imageAPI.process(buf, detect_mode, response);

});
...
Geolocating user location
On loading the webapp, the page will ask the user for permissions to get his coordinates.
(function(){
  if (navigator.geolocation){
    console.log('Geolocation supported');
  } else{
    console.log('Geolocation is not supported by this Browser/OS.');
  }
  window.onload = function(){
    var startPos;
    var geoSuccess = function(position){
      startPos = position;
      geopos = {'lat': startPos.coords.latitude, 'long': startPos.coords.longitude};

      $.post('/save_geoloc', geopos).done(function(data){
        console.log(data);
      })
    };
    navigator.geolocation.getCurrentPosition(geoSuccess);
  };
})();
Mapping with CartoDB
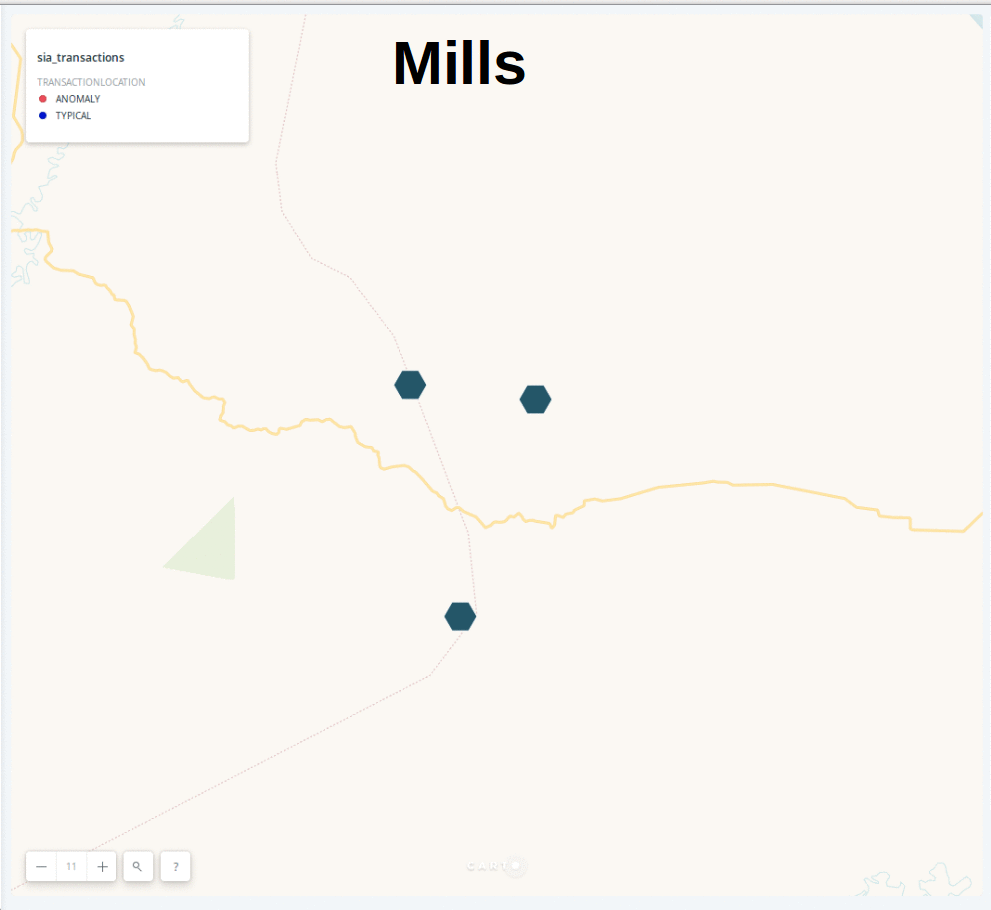
We created 4 overlays onto a Carto map for the demo. After capturing farmer transactions and geolocating the farm positions, NGOs and sustainability watchers would be able to see which farms are involved in deforestation or farming on peatland.
- Location of Mills (Hexagons)
- Location of Farms (circles)
- Deforestation (simulated)
- Peatland mapping (Purple overlay)
The locations of Mills and Farms was provided during the Growasia Hackathon. The Peatland KML data was obtained from Global forest watch - Indonesia
The difficulty in tracing solutions is that the assumption of farms supplying to mills which are of closest distance based on Voronoi partitions does not hold. Hence in practice we would still need to identify the agents that the farmers trade with and which mills the agents eventually sell the produce to. Something that would help is the traveling time from point A to point B, because the palm fruit needs to be delivered within 48 hours.
Farmer Profiling
Anthony came up with a neat site for score-carding on a farmer profile including their transaction history, land area, productivity from satelite imagery, and unsustainable practices characterisation. This would help financers credit-score farmers to provide them loans for replanting, and also to help Buyers and NGOs target education programs at farms which are engaging in unsustainable practices.
Acknowledgements
This project was taken on by Selina Sia, Solomon Sia, Suzanna Sia and Anthony Li. Thanks to Growasia for providing the data, and their partners Unilever, MUFG, Bayer. Thanks to Mum and Dad for providing the motivation and inspiration.